What Is a Healthy BMI? BMI Chart & Weight Range Guide
Body Mass Index (BMI) is one of the most widely used screening tools to determine if your weight falls within a healthy range. But what do the numbers actually mean, and where do you fall on the BMI weight distribution chart?
In this guide, we will break down the standard BMI categories for adults, provide a practical weight distribution chart, and explain why BMI is just one piece of the puzzle when it comes to your overall health.
Want to check your own BMI right now?
Try Our Free BMI CalculatorWhat Is a BMI Weight Distribution Chart?
A BMI weight distribution chart is a visual and numerical tool that categorizes individuals based on their BMI score. The score is calculated using your weight and height:
BMI = kg / m² or BMI = (lbs / in²) × 703
The chart divides the population into four main categories: Underweight, Normal Weight, Overweight, and Obese. These categories were established by the World Health Organization (WHO) to help identify potential health risks associated with being over or under a healthy weight.
The Standard BMI Categories
Here is how the standard BMI weight distribution chart looks for adults over the age of 20:
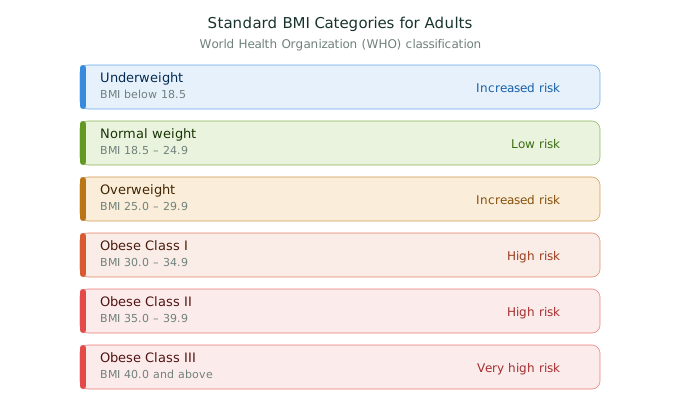
Standard BMI categories for adults established by WHO
| BMI Range | Category | Health Risk Level |
|---|---|---|
| Below 18.5 | Underweight | Increased risk (malnutrition, osteoporosis) |
| 18.5 – 24.9 | Normal Weight | Low risk |
| 25.0 – 29.9 | Overweight | Increased risk (heart disease, diabetes) |
| 30.0 – 34.9 | Obese Class I | High risk |
| 35.0 – 39.9 | Obese Class II | High risk |
| 40.0 and above | Obese Class III | Very high risk |
What Does the BMI Chart Look Like for Your Height?
Because BMI is a relationship between height and weight, the actual weight range for a "Normal BMI" changes depending on how tall you are. Here is a sample weight distribution chart for common heights:
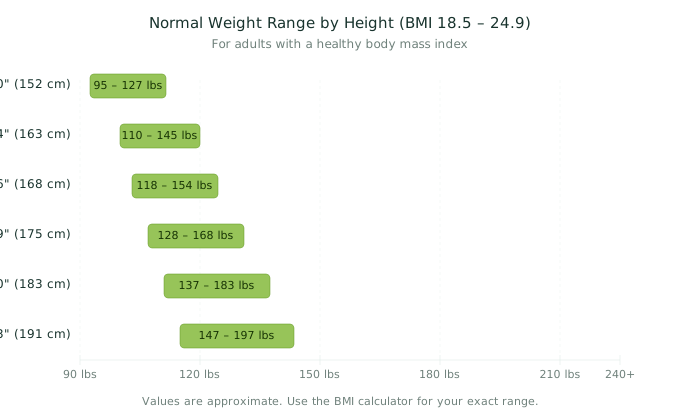
Normal weight ranges for common heights (BMI 18.5 – 24.9)
| Height | Normal Weight Range | Metric |
|---|---|---|
| 5'0" (152 cm) | 95 – 127 lbs | 43 – 58 kg |
| 5'4" (163 cm) | 110 – 145 lbs | 50 – 66 kg |
| 5'6" (168 cm) | 118 – 154 lbs | 54 – 70 kg |
| 5'9" (175 cm) | 128 – 168 lbs | 58 – 76 kg |
| 6'0" (183 cm) | 137 – 183 lbs | 62 – 83 kg |
| 6'3" (191 cm) | 147 – 197 lbs | 67 – 89 kg |
Do not see your height? Use our interactive calculator for your exact range.
Calculate Your BMI NowThe Limitations of the BMI Weight Distribution Chart
While the chart is a great starting point, it has significant limitations that users must understand:
It Does Not Measure Body Fat
BMI cannot distinguish between muscle, bone, and fat. A highly muscular athlete might have a BMI of 28 (Overweight), even though their body fat percentage is extremely low.
It Does Not Account for Age
Older adults tend to have more body fat and less muscle than younger adults. A slightly higher BMI (23–27) might actually be healthier for seniors.
It Ignores Gender and Ethnicity
Women naturally have more body fat than men. Additionally, research shows that people of Asian descent may face higher health risks at lower BMI scores, while Black individuals may have lower risks at the same scores compared to white individuals.
It Does Not Show Where Fat Is Stored
Visceral fat (belly fat) is much more dangerous than subcutaneous fat (fat under the skin). BMI does not tell you where your weight is distributed.
Better Ways to Measure Your Health
Because of these limitations, health professionals recommend pairing BMI with other measurements:
- Waist-to-Height Ratio: Your waist should be less than half your height.
- Body Fat Percentage: Measured using smart scales or calipers.
- Waist Circumference: A waist over 35 inches (88 cm) for women or 40 inches (102 cm) for men indicates higher risk, regardless of BMI.
- Blood Pressure and Cholesterol: Key cardiovascular indicators that BMI cannot capture.
If you are tracking your weight, you may also want to understand how many calories you should eat. Our Daily Calorie Calculator estimates your TDEE based on activity level, age, and goals.
Frequently Asked Questions
Is BMI different for men and women?
The standard BMI formula and categories are the same for adult men and women. However, women generally have a higher percentage of body fat, so some researchers suggest women may have a slightly lower "healthy" BMI maximum (around 24).
What is a healthy BMI for a teenager?
BMI for children and teens (ages 2–19) is calculated differently. It is plotted on a percentile chart based on age and sex, rather than using fixed adult categories. Always consult a pediatrician for interpretation.
How often should I check my BMI?
It is helpful to check your BMI every few months, or when you are starting a new fitness or diet routine. Significant changes over time matter more than a single measurement.
Why is my BMI high if I am muscular?
BMI cannot distinguish between muscle, bone, and fat. A highly muscular athlete might have a BMI in the overweight range even though their body fat percentage is very low. This is one of the main limitations of BMI. Consider also measuring your waist circumference or body fat percentage.
What should I do if my BMI is in the overweight or obese range?
Start with small, sustainable changes: improve diet quality, increase daily activity, and prioritize sleep. Our Weight Loss Planner can help you set a realistic goal and timeline. Always consult a healthcare provider for personalized advice.
Related Tools & Guides
Disclaimer: This article is for informational purposes only and does not constitute medical advice. Always consult with a healthcare provider regarding your health status.